
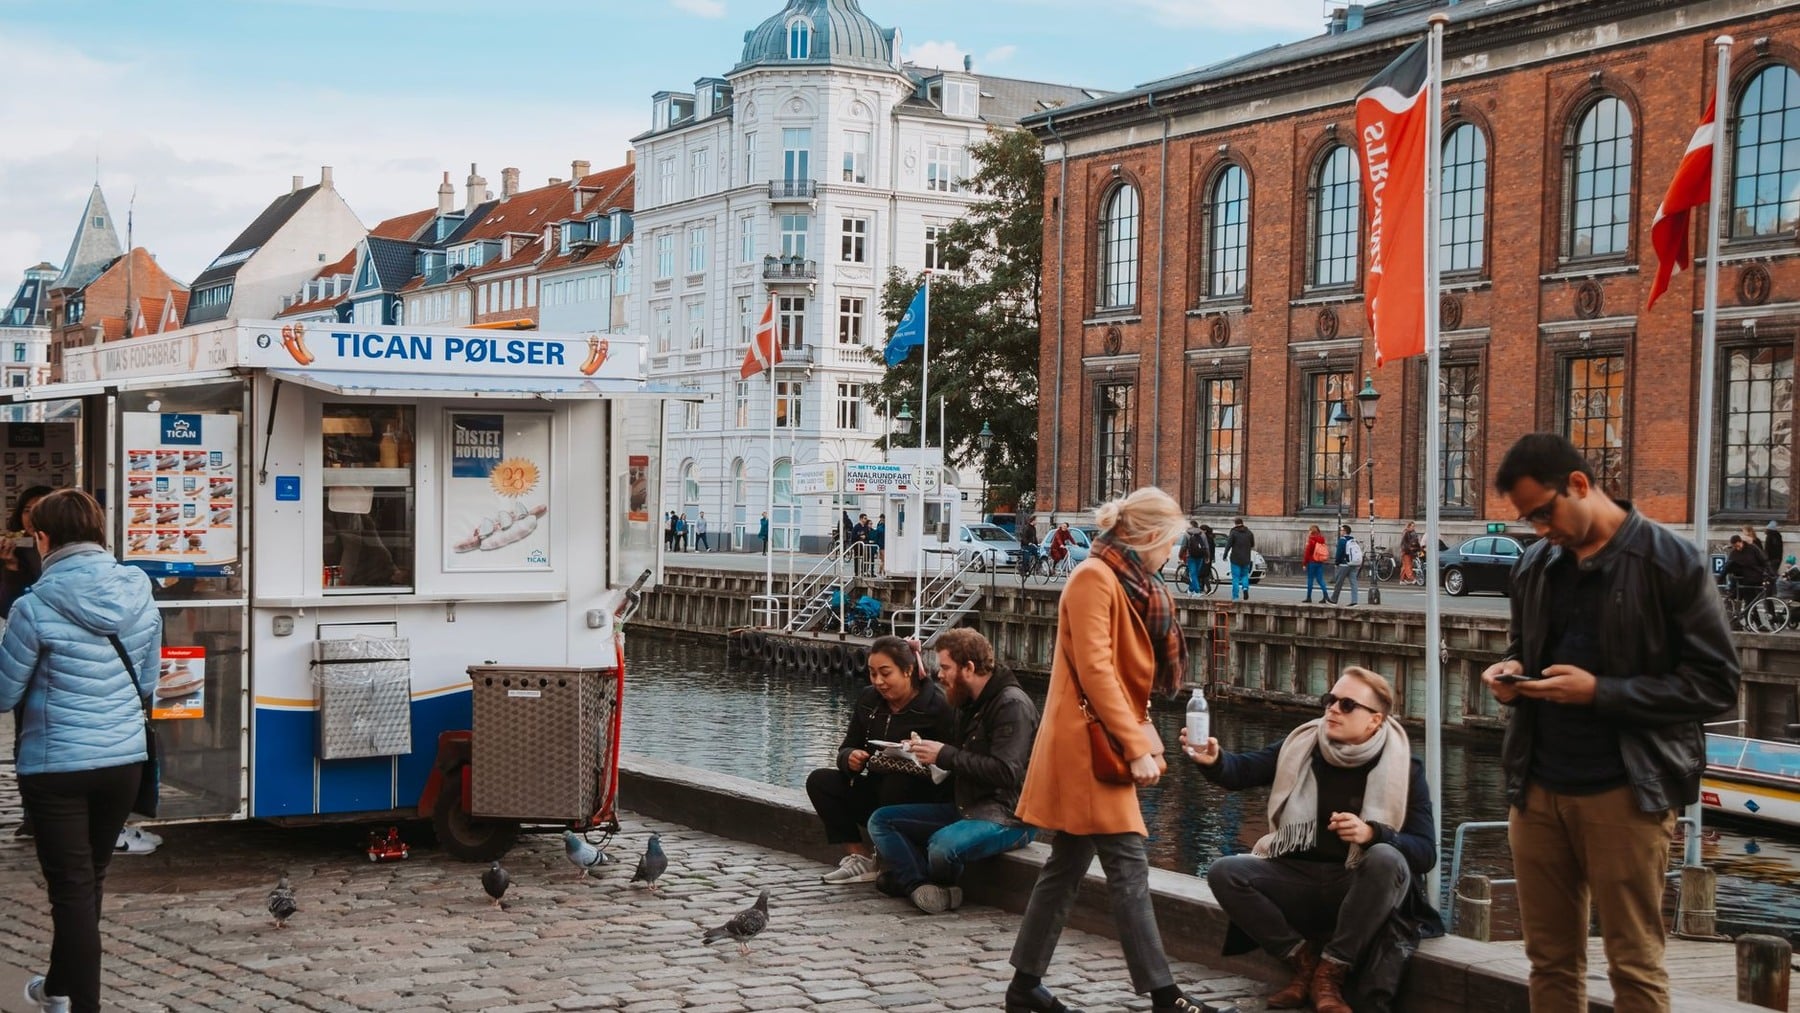

Copenhagen sits at number one in the 2026 Happy City Index, ahead of Helsinki and Geneva. Uppsala, Trondheim, Malmö and Aarhus also appear in the first ten, meaning six of the top ten places belong to Nordic cities.
The ranking is real. The familiar description of Copenhagen as the “world’s happiest city” is also reasonable shorthand for winning something called the Happy City Index. But it does not mean researchers asked Copenhageners how happy they felt and received the highest average answer.
No such question appears among the index’s 64 indicators. Copenhagen won a comparison of urban conditions, public systems and policy choices associated with a good life. That is useful information. It is not the same information as residents’ own evaluations of their lives.
Six Nordic cities fill the top ten
The official order is Copenhagen, Helsinki, Geneva, Uppsala, Tokyo, Trondheim, Bern, Malmö, Munich and Aarhus. Denmark and Sweden each contribute two cities; Finland and Norway contribute one each. Iceland’s Reykjavik is twentieth, while Oslo is fourteenth.
Copenhagen scored 6,954 points, 35 more than Helsinki. The number is a weighted point total, not 6.954 on a happiness scale and not a percentage of happy residents. Geneva followed with 6,882, placing the three leaders within 72 points of one another.
The project places the first 50 cities in a Gold group. Its own results page says the index is not designed to declare one “best city” in the world, and Copenhagen’s city page calls the exercise an informational benchmark rather than a definitive or exhaustive statement of fact.
The Copenhagen result fits a longer Nordic pattern, but it is not the same ranking as the World Happiness Report. Scandinavia Standard’s earlier explanation of Finland’s national happiness result describes an entirely different measurement based on what residents say about their own lives.
The index never asks “how happy are you?”
The project’s published methodology groups 64 indicators into Citizens, Governance, Environment, Economy, Health and Mobility. The names sound broad, but the underlying measures are concrete.
They include school density, higher-education access, housing affordability, homelessness, voter turnout, air pollution, recycling, unemployment, medical coverage, green space, working hours, paid holidays, life expectancy, public-transport use and road accidents.
Some indicators ask whether a service or policy exists, such as an open-data portal, a mental-health strategy or an integrated journey planner. Others use quantitative city statistics. A smaller group applies national context, including GDP per capita, parental leave and the use of electronic banking, to cities within that country.
What the list does not contain is a representative survey asking residents about life satisfaction, positive emotion, anxiety, meaning or whether they enjoy living in the city. No sampled Copenhagener has to say “I am happy” for Copenhagen to collect points. The index measures circumstances thought to support happiness, rather than experienced happiness itself.
That does not make the conditions irrelevant
A reliable train does not guarantee a good morning, but unreliable transport can make thousands of mornings harder. Parks cannot manufacture contentment, but they change what rest and movement are available. Affordable education, low unemployment, medical access and safe streets can widen the range of lives people are able to build.
The index is therefore closer to an assessment of urban capability or quality of life. This is not a criticism disguised as a correction. Objective conditions matter, and city governments can act on many of them more directly than they can act on a resident’s answer to a happiness question.
The Copenhagen profile shows strong results in green mobility, recycling, voter turnout, healthcare coverage and public-transport use. It also shows that Copenhagen is not above the overall average on every measure. Its school density, parks per square kilometre, green space per person and waste per resident do not all lead the field.
Urban form is part of that background. Scandinavia Standard has previously traced how Copenhagen’s rail corridors, green wedges, cycling network and pedestrian streets shaped daily movement. Those systems are experienced by residents, even when an index records them without asking how the experience feels.
The final score contains value judgements
Every composite index must decide what belongs, how much it counts and how incomparable records become a common score. In this one, all 64 indicators receive explicit weights. Life expectancy and green space per person each count for 3 per cent. GDP per capita contributes 0.5 per cent, while rent affordability contributes 2.48 per cent.
Quantitative city indicators are normalised against the highest and lowest values observed in the complete dataset. That converts different units, from years of life to micrograms of air pollution, into comparable scores. Binary measures award points when a policy or service exists. Selected national indicators are capped so that country context cannot dominate municipal performance.
These rules are published and understandable, which is a strength. They are still choices. A different set of weights could change the order, and the presence of a strategy does not by itself show how well that strategy works. Min-max scoring can also make results depend on which cities and extreme values enter the comparison.
Data availability shapes the field before scoring begins. The project initially reviewed 3,417 cities, selected 924 for deeper analysis, and received 457 city datasets for validation. Ten records from each submitted dataset were sampled for peer review. In the end, 272 passed the threshold and the top 250 scored cities were published. Kyiv appears symbolically as number 251 without a comparative score.
That is a substantial data exercise, but not a census of every city on Earth. A city with stronger public data, a municipal submission or easier international comparability has a clearer route into the table than a poorly documented place. Rank one means first within this method and this validated pool.
Surveyed happiness answers another question
The OECD’s updated guidance treats life evaluation, emotion and a sense of meaning as distinct parts of subjective wellbeing. Its primary measure directly asks people to rate how satisfied they are with life as a whole on a zero-to-ten scale.
The World Happiness Report likewise builds its headline ranking from residents’ life evaluations, not from an index of the social and economic factors used to explain them. In its global analysis of cities, respondents placed their lives on a ladder from the worst possible to the best possible life.
That difference is not semantic. If Copenhagen topped a representative life-evaluation survey, the conclusion would be that sampled residents rated their lives highest on average. In the Happy City Index, the conclusion is that Copenhagen scored highest on a model of conditions believed to make urban wellbeing more achievable.
Direct answers have their own limits. Sampling uncertainty, question order, cultural response styles, translation and current circumstances can influence results. Objective indicators are more concrete but cannot reveal private experience. Surveys capture experience but can be noisy and cannot by themselves explain which city systems produced it. The two approaches work best as complements.
So what does “happiest city” mean here?
In the 2026 Happy City Index, it means Copenhagen received the strongest weighted score for a chosen set of urban conditions. It does not mean every Copenhagener is happy, that the average resident feels better than everyone in Helsinki, or that Copenhagen leads every category.
Research using resident reports can reveal different relationships. Scandinavia Standard’s look at shared meals and happiness across 142 countries shows what this looks like: people answered questions about both behaviour and how their lives felt, allowing the two to be compared.
Nor does the distinction make the ranking empty. A city cannot promise joy, but it can reduce avoidable friction, protect health, make movement easier, maintain public space and create institutions residents have reason to trust. Those achievements are worth measuring even when the name on the table reaches beyond what the data literally capture.
Copenhagen’s result is best read as a claim about the stage, not every life unfolding on it. The city appears unusually good at supplying many of the institutions, services and physical conditions that can make wellbeing easier. Whether residents experience those possibilities as happiness remains a separate question, and one that only they can answer.